
Grant Park Multi Alternative Strategies Fund
Performance as of September 30, 2025
|
|
Q3 |
2025 |
1 Year |
3 Year |
5 Year |
Since Inception |
Annualized: Oct 2020 – Sep 2025
|
|||||||
|---|---|---|---|---|---|---|---|---|---|---|---|---|---|---|
|
Without Max Sales Charge |
||||||||||||||
|
Class I (GPAIX) |
5.68% |
9.80% |
6.43% |
4.48% |
4.88% |
4.85% |
6.02 |
0.29 |
0.51 |
0.19 |
||||
|
US OE Macro Trading |
4.80% |
7.83% |
6.91% |
5.50% |
4.54% |
2.98% |
4.20 |
0.34 |
0.67 |
0.18 |
||||
|
S&P 500 TR |
8.12% |
14.83% |
17.60% |
24.94% |
16.47% |
13.60% |
15.84 |
0.84 |
1.00 |
1.00 |
||||
|
Barclays Agg Bond |
2.03% |
6.13% |
2.88% |
4.93% |
-0.45% |
2.16% |
6.37 |
-0.56 |
0.62 |
0.25 |
||||
|
With Max Sales Charge |
||||||||||||||
|
Class A (GPAAX) |
-0.52% |
3.36% |
0.07% |
2.16% |
3.39% |
4.05% |
NA |
NA |
NA |
NA |
||||
|
Fund inception is 12/31/2013. The maximum sales charge (load) for Class A is 5.75%. The performance data quoted here represents past performance. For performance data current to the most recent month end, please call toll-free 855.501.4758. Current performance may be lower or higher than the performance data quoted above. Past performance is no guarantee of future results. The investment return and principal value of an investment in the Fund will fluctuate so that investors’ shares, when redeemed, may be worth more or less than their original cost. The Fund’s total annual operating expenses are 1.79%, 2.54%, 1.54%, and 1.79% for Class A, C, I and N respectively. Please review the Fund’s prospectus for more information regarding the Fund’s fees and expenses, including other share classes. |
||||||||||||||
Current Fund performance available at www.morningstar.com
Historical Performance
Analyzing a fund’s ability to deliver consistent performance metrics over multiple market cycles is a critical component of selecting an investment. GPAIX’s historical performance helped improve portfolio efficiency and diversification over short and long-term periods.
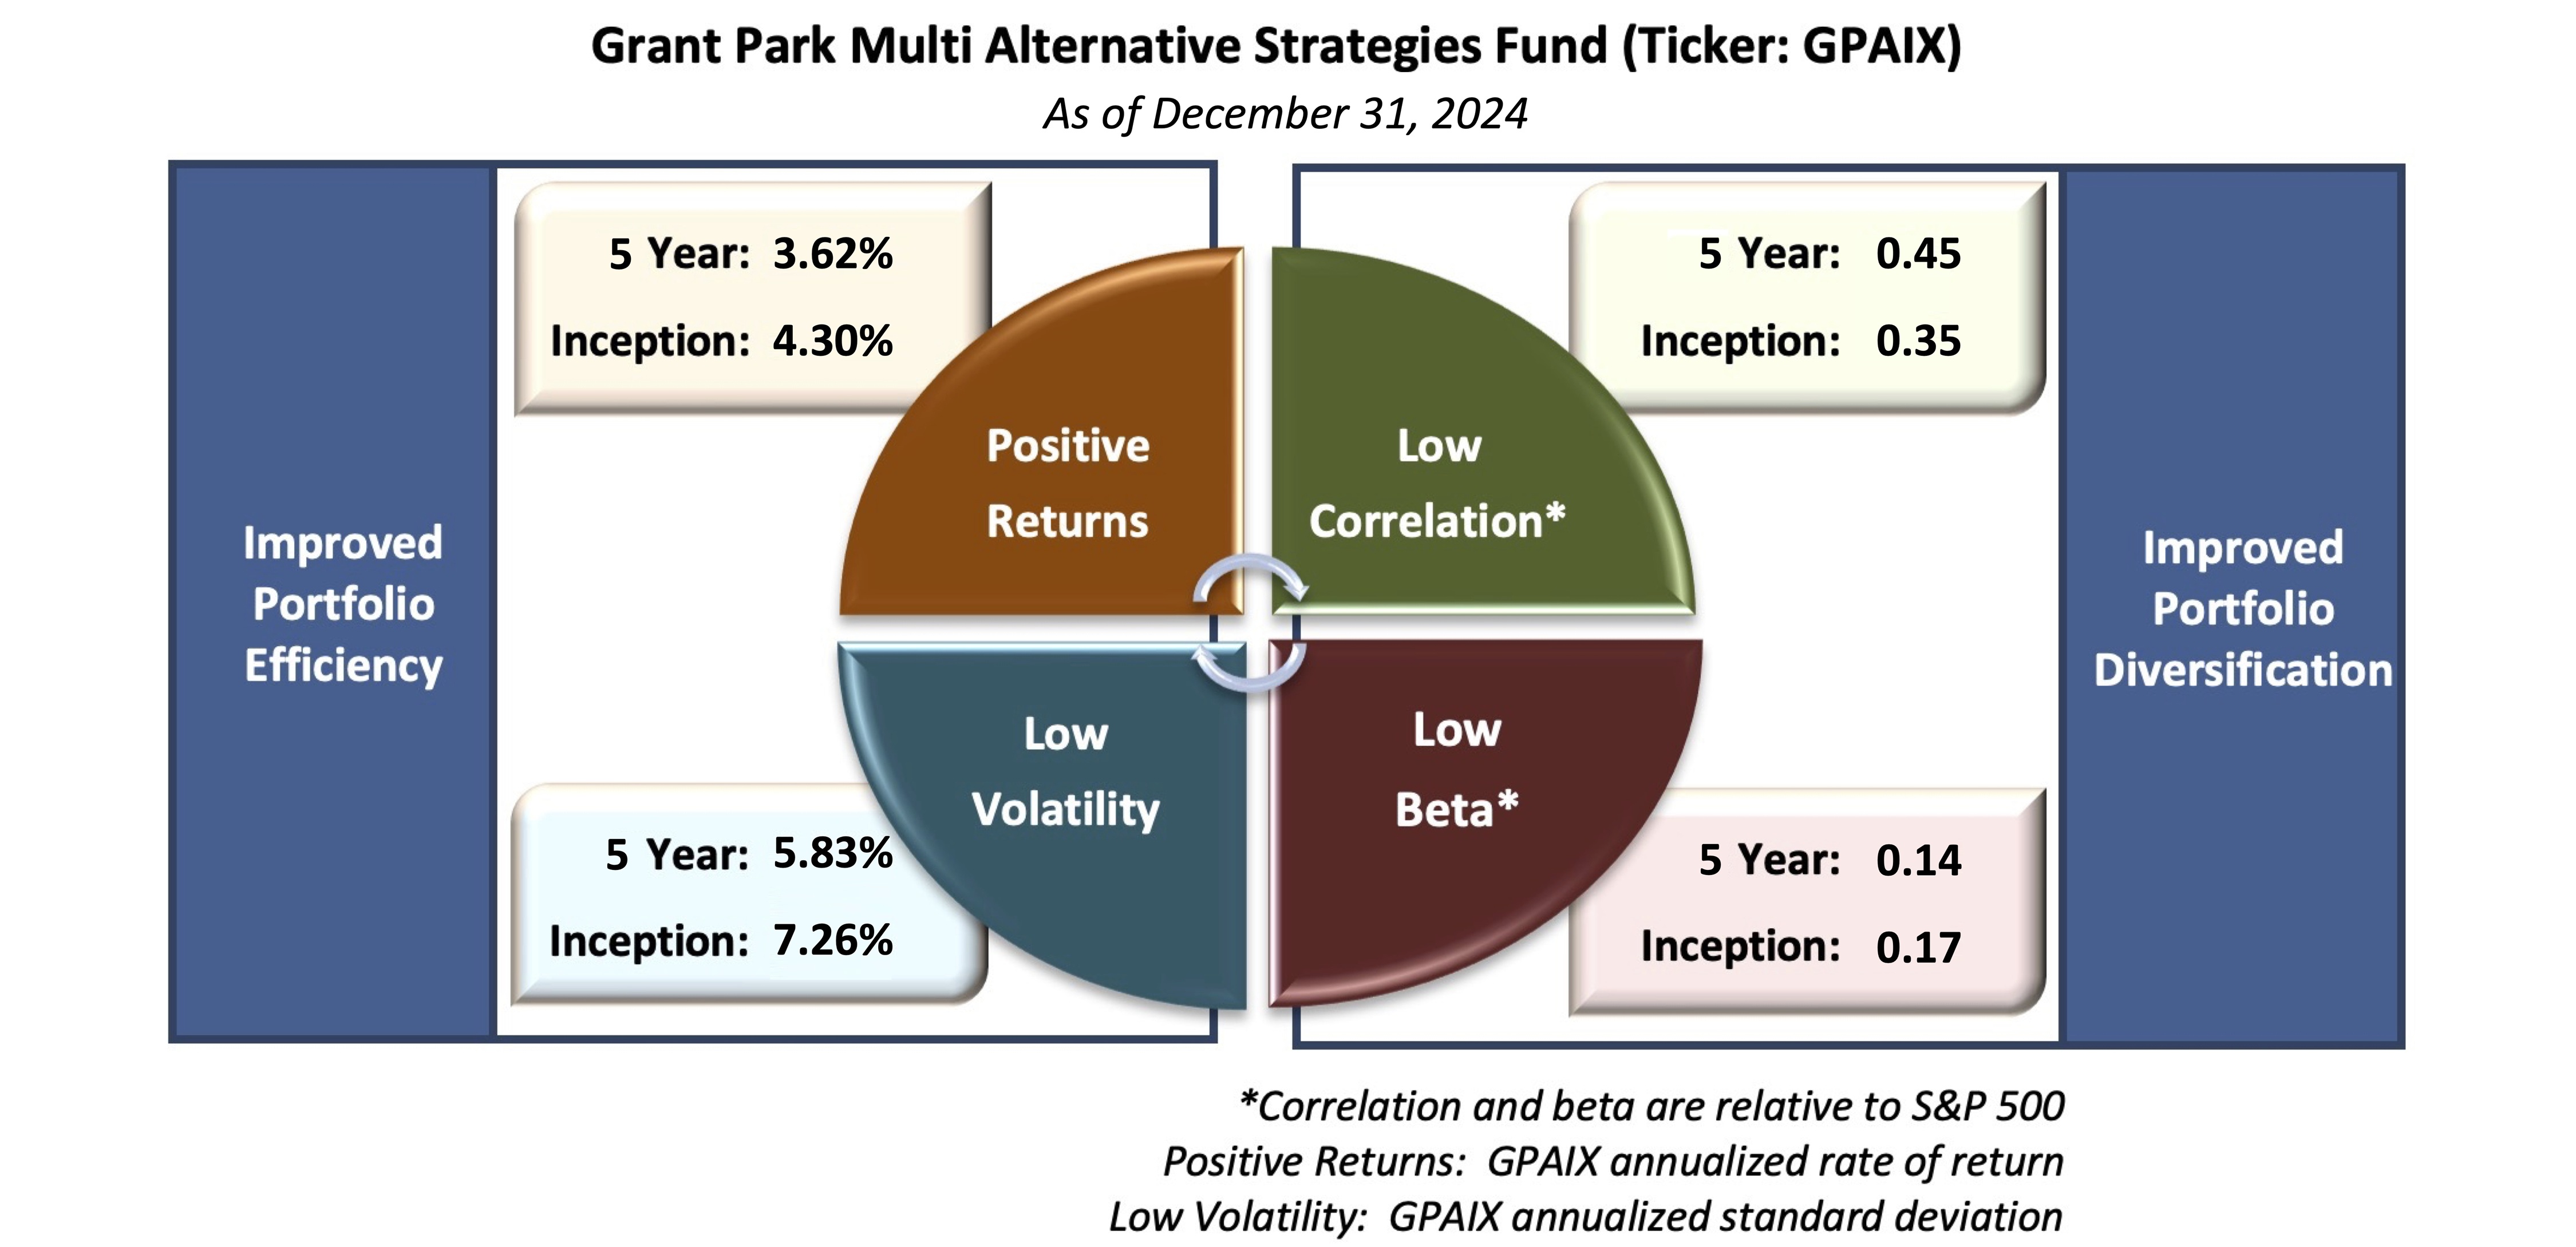
Past performance is no guarantee of future results.
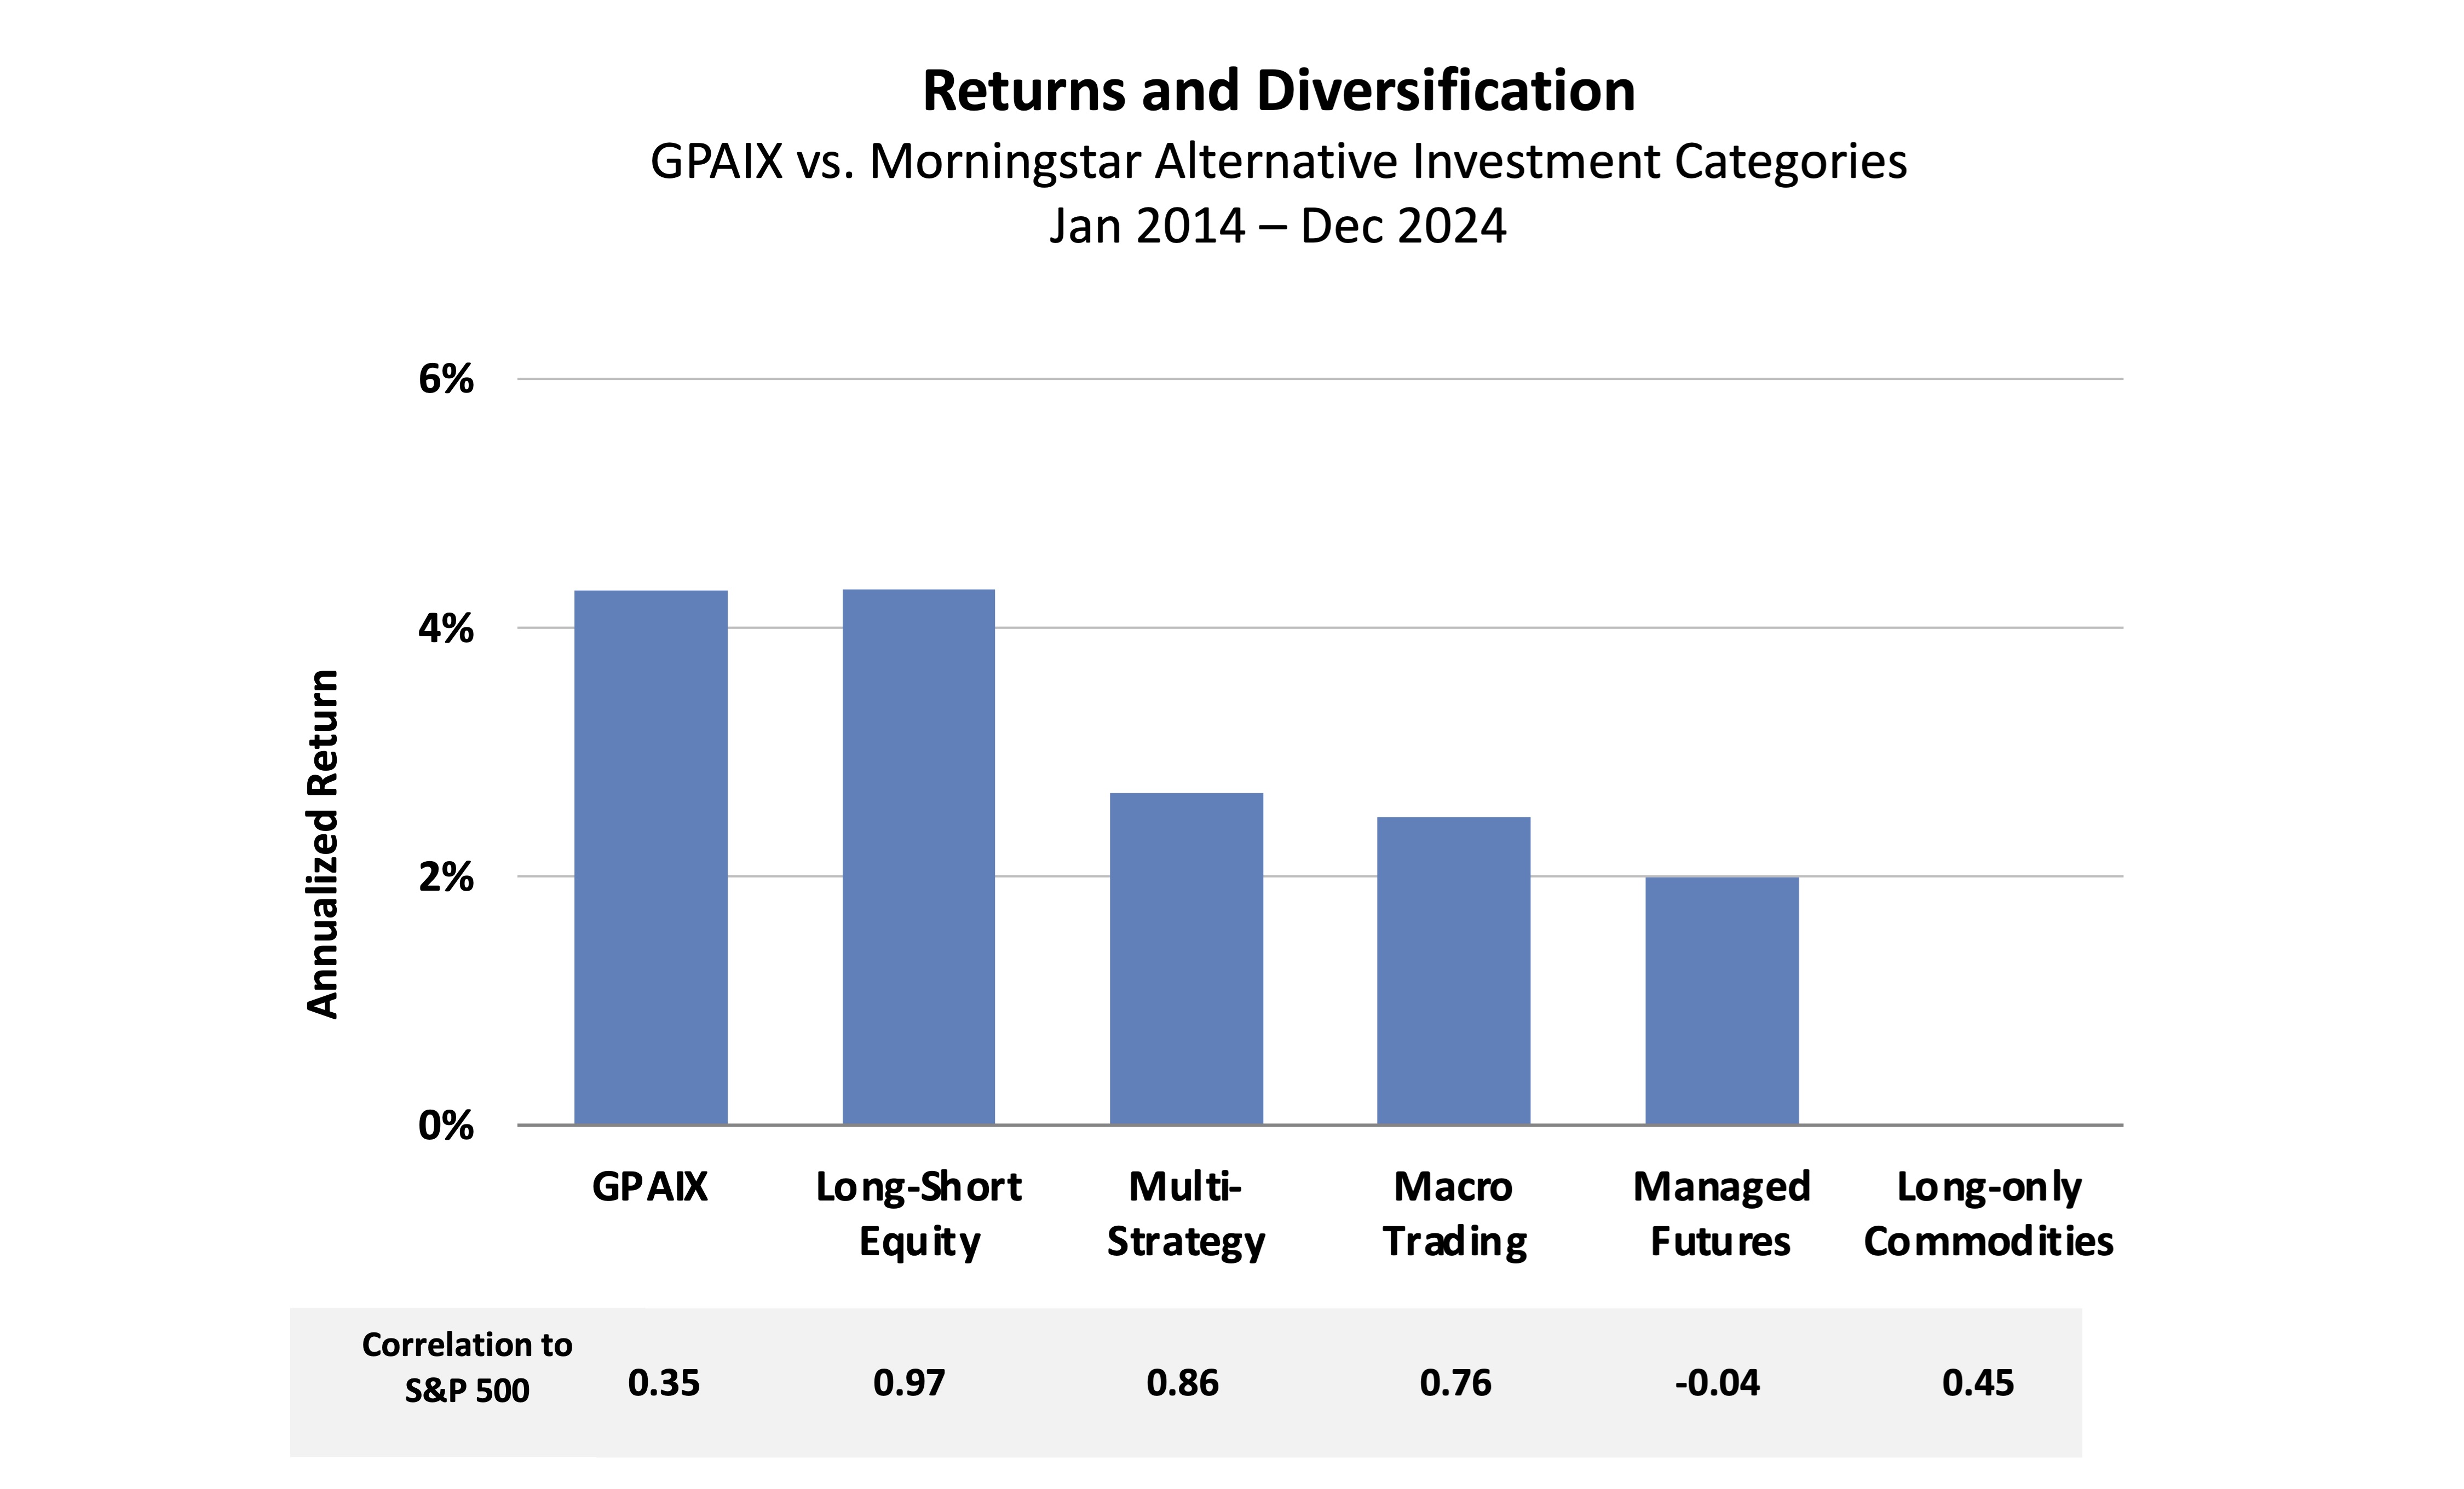
Portfolio Benefits
GPAIX has provided long-term positive returns, while maintaining a low correlation to traditional markets. The Fund is a comprehensive portfolio diversifier and historically avoided a signification downside risk in long-only equity, fixed income, and commodity indices.
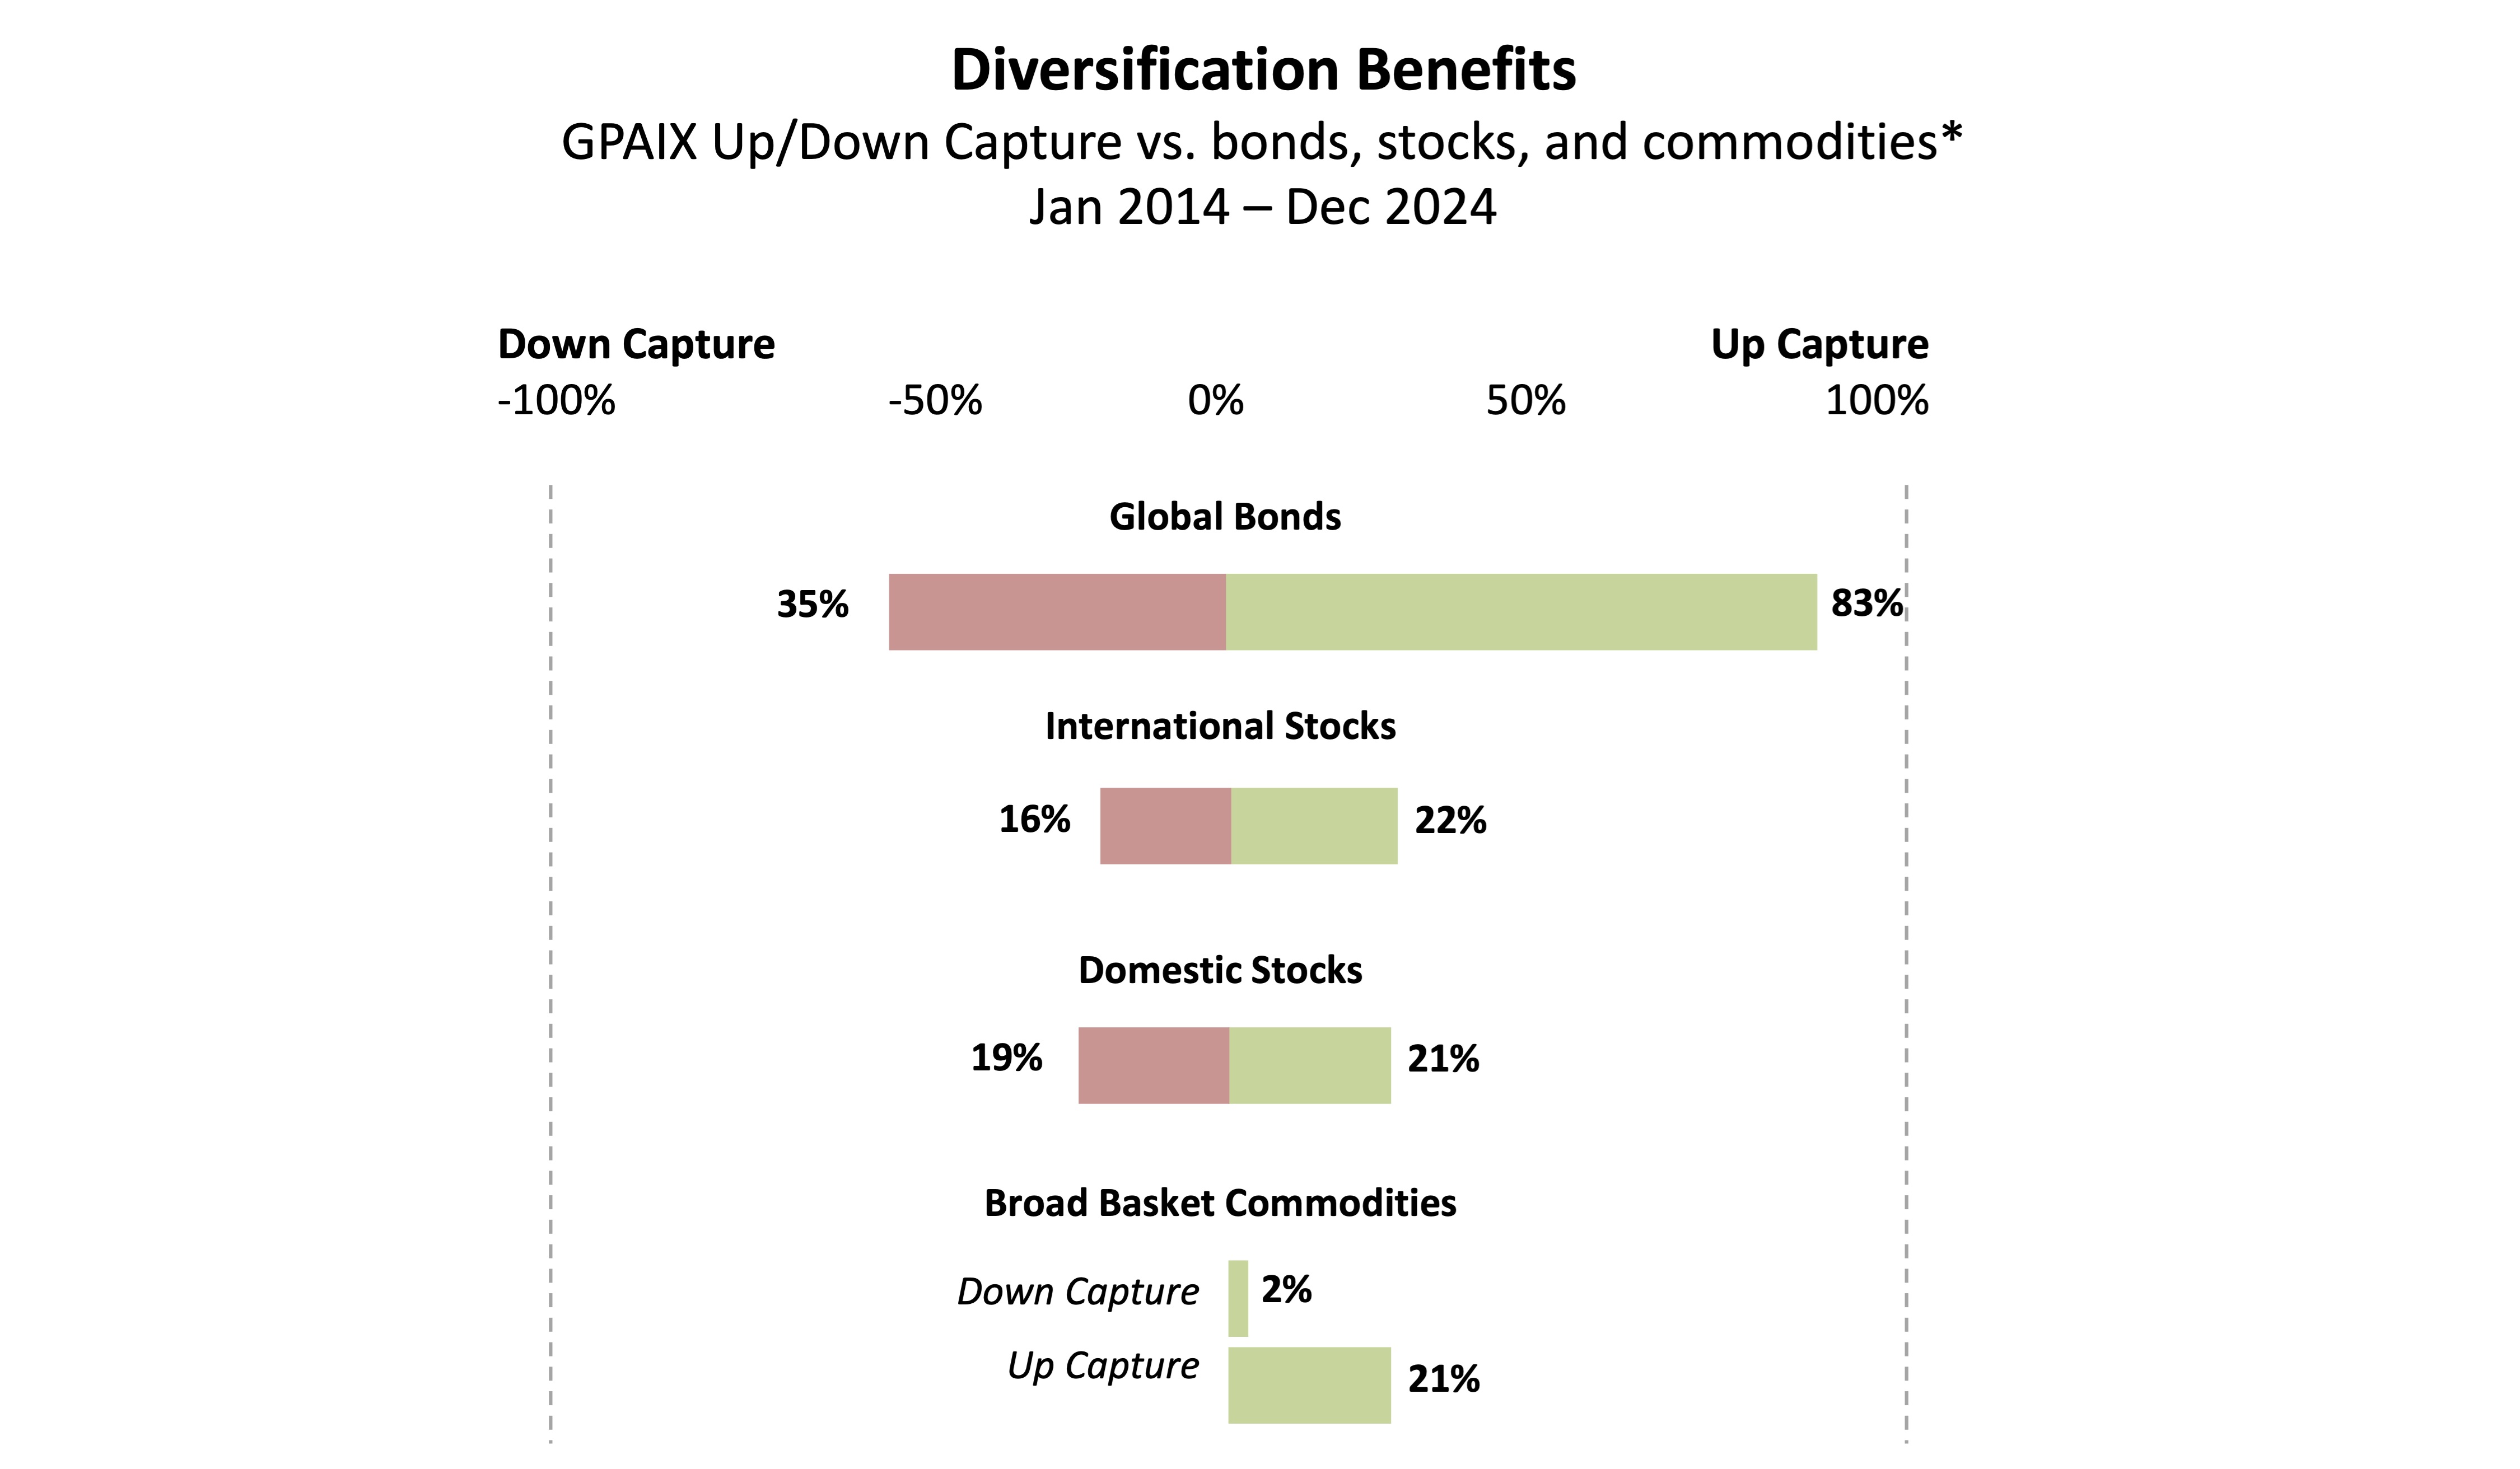
*Global Bonds: Barclays Global Agg Bond Index, International Stocks: MSCI All World Index,
Domestic Stocks: S&P 500 TR Index, Commodities: Morningstar Broad Basket Commodities Index
The indices shown are for informational purposes only and are not reflective of any investment. As it is not possible to invest in the indices, the data shown does not reflect or compare features of an actual investment, such as its objectives, costs and expenses, liquidity, safety, guarantees or insurance, fluctuation of principal or return, or tax features. Diversification does not assure a profit or protect against loss in a declining market. Past performance is no guarantee of future results.
Diversified Portfolio
Investments in the Fund are made across multiple regions and sectors. GPAIX historically has produced a blend of long-term positive returns and diversification.
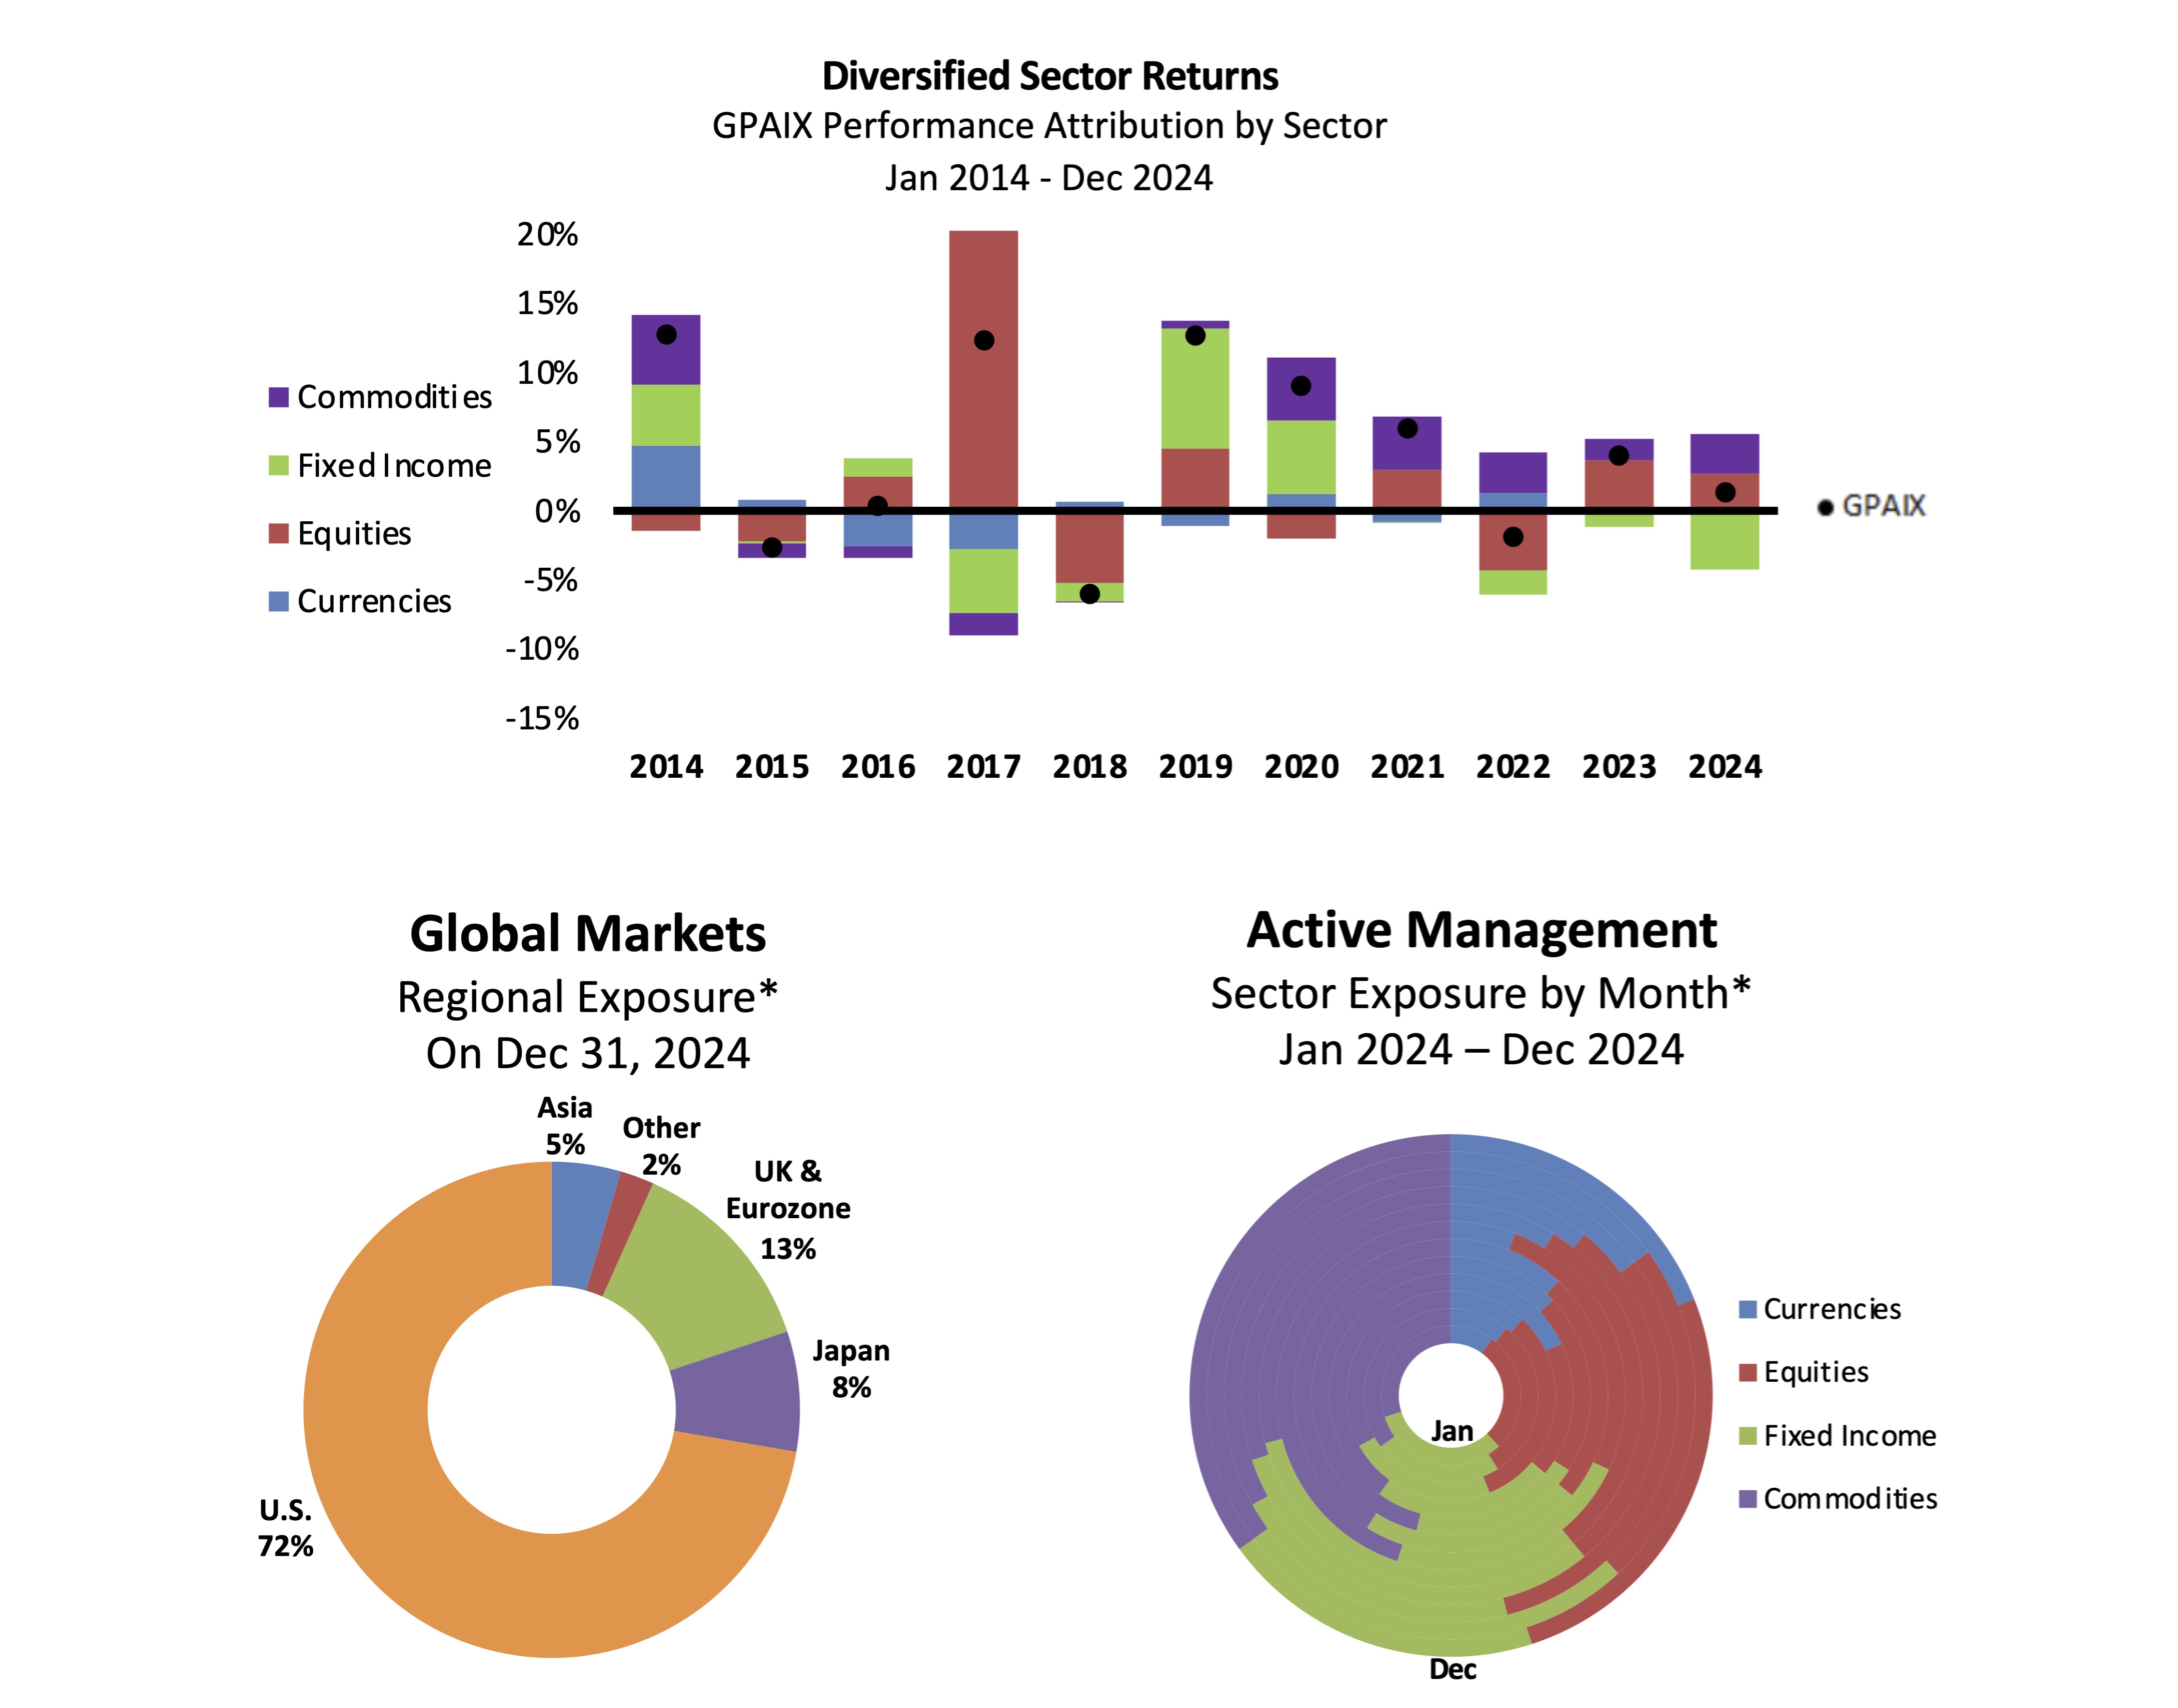
The Fund's allocations to specific sectors and markets are presented to illustrate examples of the diversity of strategies accessed by the Fund. Portfolio holdings are subject to change and should not be considered a recommendation or investment advice.
Monthly Performance
GPAIX has historically provided diversification for both stocks and bonds.
|
|
Jan |
Feb |
Mar |
Apr |
May |
Jun |
Jul |
Aug |
Sep |
Oct |
Nov |
Dec |
YTD |
|---|---|---|---|---|---|---|---|---|---|---|---|---|---|
|
2025 |
1.62% |
-0.19% |
-0.19% |
0.56% |
-0.28% |
2.34% |
0.27% |
1.74% |
3.59% |
9.80% |
|||
|
2024 |
-1.51% |
1.44% |
2.55% |
0.00% |
-0.28% |
-1.02% |
0.00% |
0.37% |
2.98% |
-4.25% |
1.04% |
0.19% |
1.32% |
|
2023 |
2.02% |
-2.55% |
-0.39% |
1.46% |
-0.77% |
2.03% |
0.09% |
-1.23% |
-1.15% |
-0.78% |
1.07% |
4.29% |
3.99% |
|
2022 |
-0.28% |
1.29% |
2.64% |
-0.09% |
-0.62% |
-1.07% |
1.18% |
-2.50% |
-0.92% |
0.28% |
-0.46% |
-1.24% |
-1.88% |
|
2021 |
-0.09% |
2.99% |
-0.94% |
2.33% |
1.01% |
-1.50% |
-0.17% |
0.00% |
0.25% |
4.06% |
-2.19% |
0.22% |
5.94% |
|
2020 |
0.00% |
0.94% |
0.65% |
1.02% |
0.64% |
0.09% |
1.46% |
0.54% |
-1.96% |
-1.00% |
2.67% |
3.81% |
9.08% |
|
2019 |
1.23% |
-0.19% |
4.13% |
1.44% |
0.53% |
3.36% |
1.28% |
3.71% |
-2.60% |
-0.92% |
0.08% |
1.55% |
14.26% |
|
2018 |
7.20% |
-6.14% |
-1.40% |
-0.35% |
-1.78% |
-0.81% |
0.27% |
0.64% |
-0.81% |
-4.37% |
1.52% |
0.48% |
-5.96% |
|
2017 |
0.97% |
2.98% |
-1.40% |
1.14% |
1.78% |
-2.57% |
2.64% |
2.48% |
-3.77% |
4.19% |
1.79% |
1.78% |
12.35% |
|
2016 |
2.58% |
3.63% |
-0.09% |
-1.17% |
-1.09% |
4.05% |
2.30% |
-2.59% |
0.18% |
-3.90% |
-3.87% |
0.74% |
0.36% |
|
2015 |
4.58% |
-0.79% |
0.27% |
0.00% |
0.44% |
-3.42% |
0.18% |
-2.81% |
1.12% |
1.29% |
-0.18% |
-3.05% |
-2.61% |
|
2014 |
-1.40% |
2.43% |
-1.29% |
0.50% |
0.90% |
1.19% |
0.59% |
2.72% |
0.38% |
0.66% |
3.09% |
2.41% |
12.75% |
Past performance is no guarantee of future results.
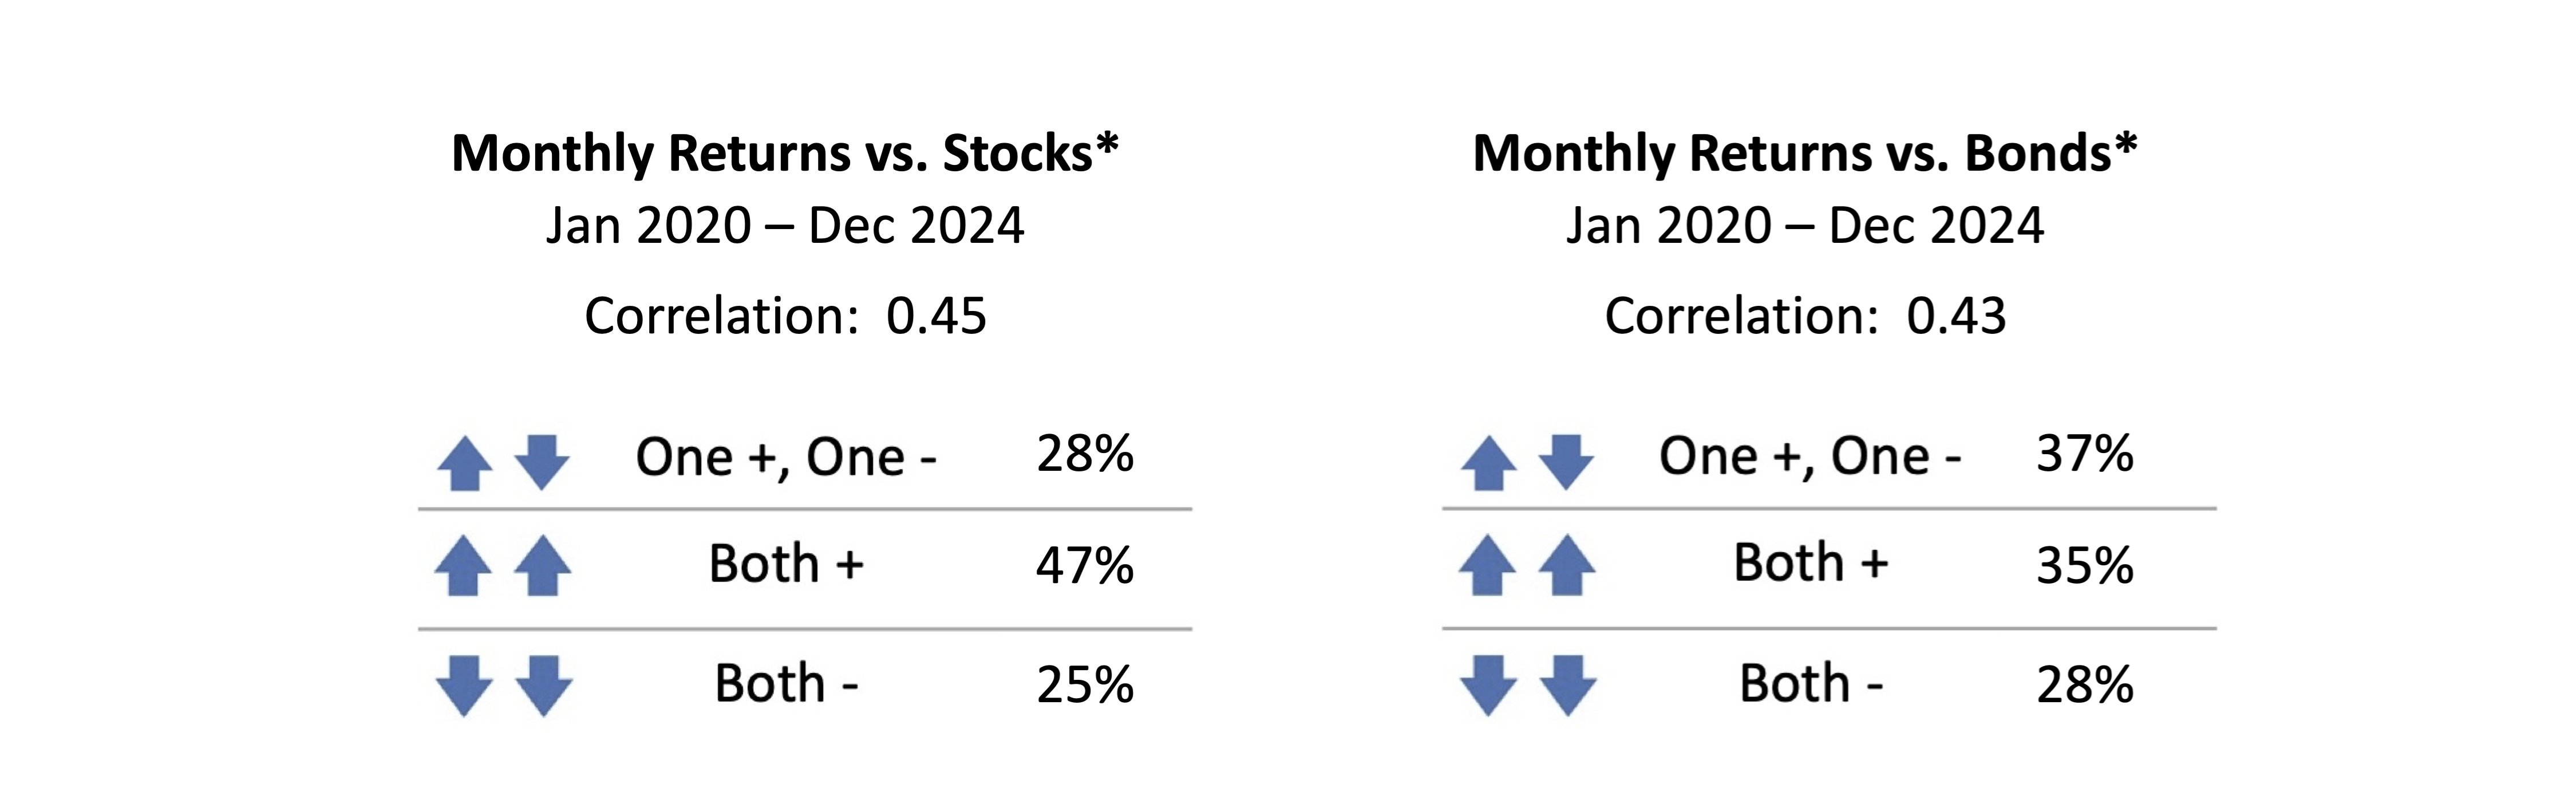
*Stocks: S&P500; Bonds: Bloomberg Barclays Global Agg
Program Overview
Investment Philosophy
- Pursue competitive, risk-adjusted returns.
- Maintain low correlations to equity and
fixed income investments. - Operate strict risk management.
Investment Program
- Multiple actively-managed quantitative strategies.
- Invests across global commodity, currency, fixed
income and equity markets. - Ability to trade long and short positions.
Sub-Adviser

- Since 1988, continuously traded global futures markets.
- Utilize a disciplined and systematic investment methodology.
- Research process systematically adapts to trading and risk management systems to the current market environment.
- Proven expertise in managing a diversified portfolio of 80 financial and commodity markets integral to the global economy.
- Each of the Firm's principals have over 25 years experience managing client assets through various market cycles and periods of acute economic and geopolitical distress.
All charts and graphs prepared by Dearborn Capital Management. The indices shown are for informational purposes only and are not reflective of any investment. As it is not possible to invest in the indices, the data shown does not reflect or compare features of an actual investment, such as its objectives, costs and expenses, liquidity, safety, guarantees or insurance, fluctuation of principal or return, or tax features. Past performance is no guarantee of future results. Diversification does not assure a profit or protect against loss in a declining market.